In this article, you will understand how the hierarchy of locations works within the energy management platform.
This article includes the following sections:
- Introduction
- Hierarchy elements
- Points to consider when creating the location hierarchy
- Configuring the location hierarchy
- Viewing the location hierarchy
- Examples of different location hierarchies
Introduction
The platform has a very useful tool for multi-location projects where you want to maintain a logical structure and have aggregated indicators by zone quickly and efficiently.
The platform allows locations to be organised based on hierarchical and/or geographical criteria. This way, it enables better analysis by geographical or organisational zones, aggregating energy consumption of electricity, gas, water… To revisit the most basic concepts related to locations, take a look at our article: What is a location?
Hierarchy elements
The hierarchical scheme of the platform is as follows. We have 4 different elements explained below.
- Global: root of the project
- Zone: sublevel. It can represent a hierarchical or geographical zone (Europe, Spain, North Campus, etc.)
- Location: the logical unit of the platform. Depending on the project, a location can be a simple office, a building, a factory, an airport, etc.
- Sublocation: one step beyond the location. It represents a region or section of the location, such as: a floor of a building, a room, an area of a building, a hall, etc.
Depending on the created elements, they will have certain configuration parameters or not. The following table indicates the possibilities available for each of the elements. For example, ratios can be created and configured in a Location, but not in a Zone.
Points to consider when creating the location hierarchy
The elements described below should be taken into account before creating the location hierarchy.
- Devices can only be assigned to one hierarchical element (global, zone, location or sublocation).
- Several reports are configured through categories in locations. This means that only one device in that location or sublocation will be included in these types of reports.
- Ratios (or KPIs) apply to locations or sublocations. Ratios affect ALL devices in that location or sublocation.
- Tags can be applied to locations or sublocations, so if you think you need them to compare different buildings in your portfolio, keep this in mind!
The concept of inheritance
The concept of inheritance is the most important to consider when defining how to organise the location hierarchy.
If you assign a device to a zone, the locations and sublocations below it will inherit that device assigned to that zone. Or if you assign a device to a location, it will also appear in the sublocation hanging from it. This will help configure projects much more quickly. For example, if some of your buildings are located in the same city, you can assign the "Outside temperature" device to the "Zone" (representing the city), so all locations will inherit the corresponding temperature device. Thus, you only need to assign the device once instead of doing it for each location.
The concept of inheritance will be applied in all configuration and display menus of the platform. For example, if you are configuring the categories of a sublocation, you will be able to select devices that are in the upper location. If you are displaying a graph, you can also show all devices that are also in an upper location.
Following an example:
- If the hierarchy element Sublocation 1 is selected, devices assigned to Test, Zone 1, Location 1, Sublocation 1 and Sub-Sublocation 1 would be available.
- If the hierarchy element Location 2 is selected, devices assigned to Test and Location 2 would be available.
- If the hierarchy element Test is selected, ALL devices in the account would be available.
Configuring the location hierarchy
Viewing the location hierarchy
You can view the entire project from any point in the tree you want. This way, you can quickly navigate to any location using the browser located at the top of the initial screen. To learn more about filtering tools when navigating the platform, click here.
Examples of different location hierarchies
This section shows three examples of location hierarchies:
- Suppliers or other companies operating in several countries or geographical zones
- Companies with tenant-billing strategies
- Companies with several lines of business or building types
Example 1 - Suppliers or other companies operating in several countries or geographical zones
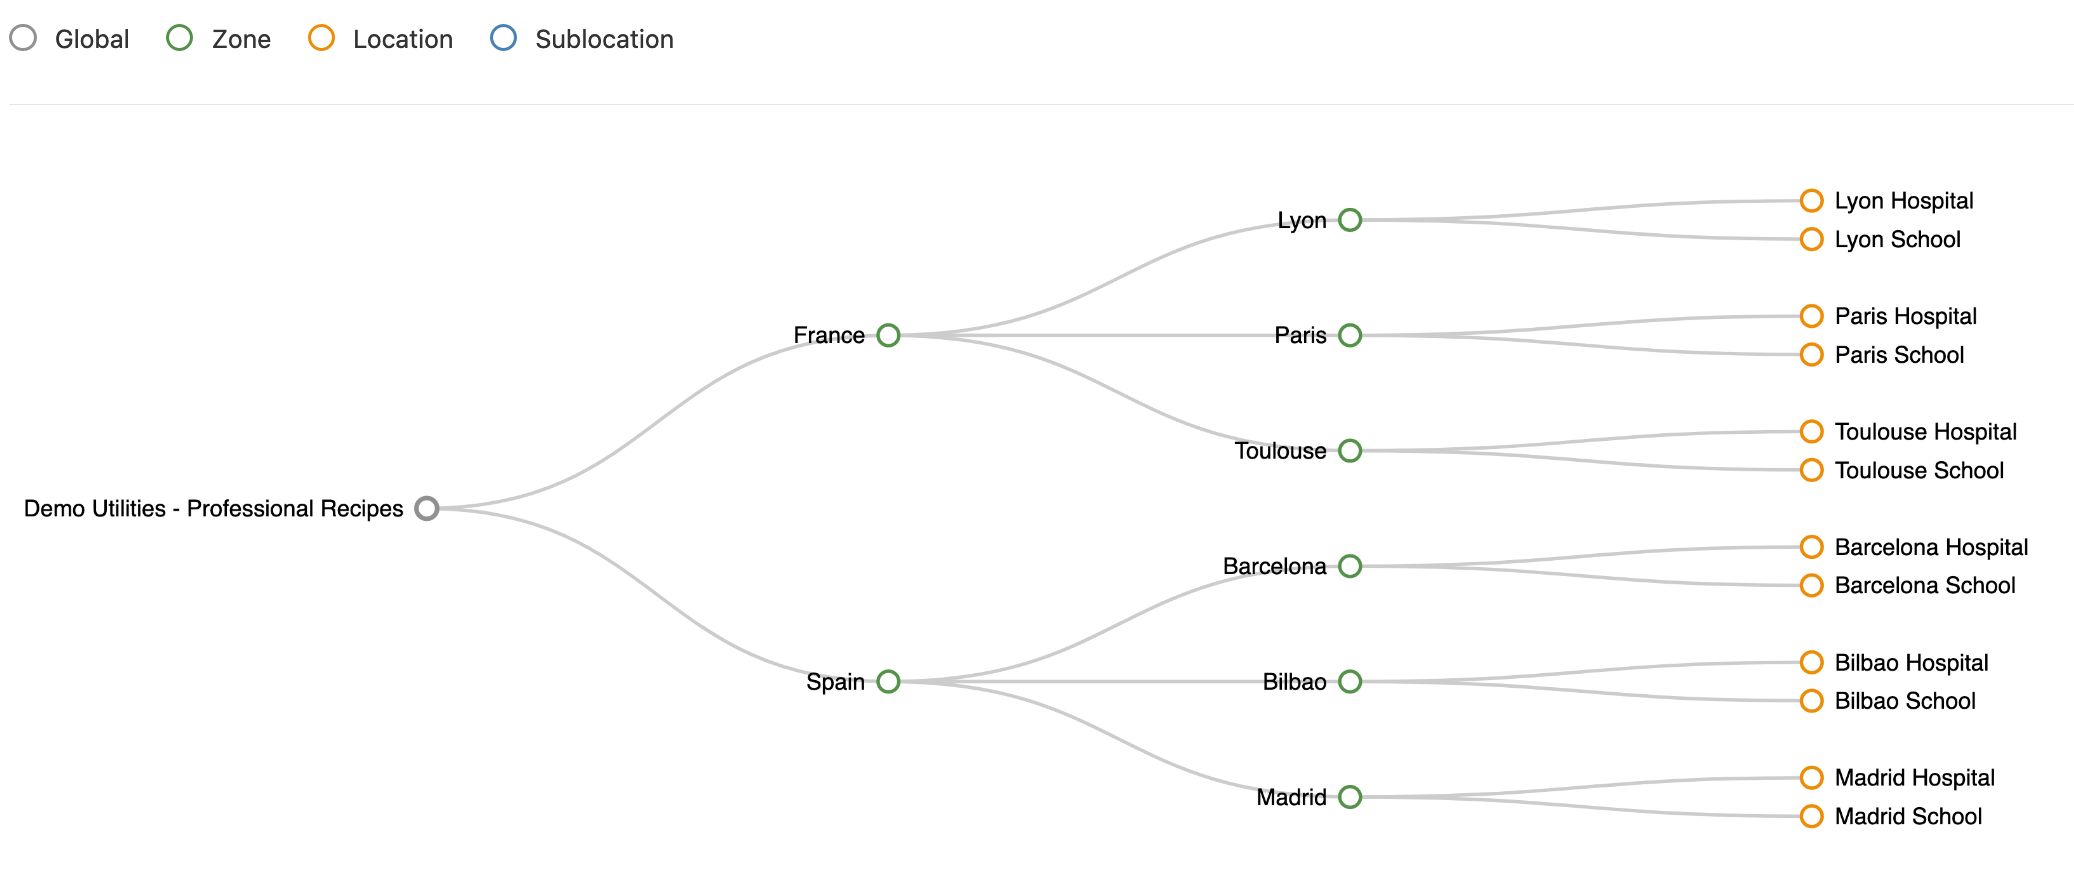
In this example, the first hierarchy level corresponds to each country and the second hierarchy level corresponds to cities, both being zones (in green). The next hierarchy level is locations representing a building in that specific city (in yellow). In the example, there are two types of buildings, schools and hospitals, which have been tagged as such in each location configuration:
This distribution allows the comparison of buildings in the same region both in reports and dashboards. Additionally, it allows creating a report for each specific location automatically.
Selecting the country level in the hierarchy limits the analysis to those devices located within the zones and locations under that country:
Tags also allow filtering devices on analysis screens by building type:
Furthermore, we can use the hierarchy and tags in the analysis of multiple devices in Advanced Analysis, aggregating the consumption of all locations under a hierarchy level, or aggregating only the consumption of those locations with a specific tag.
Example 2 - Companies with tenant-billing strategies
For tenant-billing within the same building, the proposed location hierarchy would be to use cities as the first hierarchy level (if the company operates in multiple cities); buildings as the second hierarchy level, both being zones.
The next hierarchy level would be locations representing an apartment within a particular building. If there are parts of the apartment (such as rooms) that are of interest, they could be represented as sublocations, which would become the last elements of the hierarchy.
This way, the consumption of each area within the apartment could be analysed and buildings could be aggregated geographically.
Example 3 - Companies with several lines of business or building types
In this case, it would be useful to analyse each line of business or building type. If necessary, a differentiation between cities or geographical zones could also be established. Translating these statements into the location hierarchy, it should be organised as follows:
Through this organisation, buildings could be easily aggregated by zone and building type, which would facilitate identifying abnormal consumption.
Additionally, the use of tags could further help customise analyses.